


The difference between success and failure in racing or cruising is often determined by the thoroughness of the preparation-often by just getting the weather right (published June 2013)
It’s almost time to start your cruising rally, and some time ago, you noticed that getting hammered by unexpected cold fronts wasn’t as much fun as it used to be. Over the years, you’ve also become more sophisticated in your passage preparations and increasingly aware of the overwhelming amount of weather information that is available on the Internet. The operative word here is “overwhelming.”
To cut this flood of information down to a manageable size, you must ask yourself two questions: What kind of information do I want and from what part of the world? Preparing for a two-day coastal cruise will be a lot different from planning a transoceanic passage. Some of the same weather sites will be used, but the time spent preparing and analyzing data will differ.
Long-distance sailors may collect data for weeks, or even months, before departure to determine the degree to which the information will be accurate: Will those 48-hour or 96-hour forecasts be reliable? Only time and experience will tell, of course, but the comforting news is that weather information from many sources is considerably more accurate today than it was only a decade ago.
 In preparation for a long-distance race or an extended offshore passage, collect information from a variety of sources, organize it in a three-ring binder, and compare and contrast the information. Include in this data offshore forecasts that are also sent out as faxes by single-sideband (HF) radio, buoy or ship reports, long-range, computer-generated models and any of a variety of satellite images. By collecting such information from the same sources over a period of time, you can develop an understanding of how weather patterns move and evolve and how fast or slow these systems may change.
Each year differs somewhat from the climatological average, and by studying the weather systems leading up to departure, one can also develop a sense of how a particular year’s anomalies differ from the average. By comparing the computer-generated forecast models and weather fax charts to real time buoy reports several days after the forecasts are generated, you will develop a level of confidence in the forecasts’ reliability. Your life or property can depend on those forecasts and now you have a way to rate their accuracy.
In U.S. waters, the weather-preparation cornerstone is the National Weather Service (NWS). Access NWS marine charts at http://weather.noaa.gov/fax/marine.shtml. The charts provided at this site are the same ones sent as weather faxes over HF radio and they may well provide the most comprehensive weather data offshore mariners receive while underway. Prudent sailors will learn how to interpret these images as well as assess their degree of reliability.
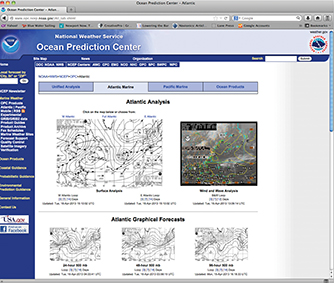
Over the years, with increased and improved weather-data input, the information conveyed on these charts and its accuracy has greatly improved. Marine-forecast products can also be found at the Marine Prediction Center’s website at http://www.opc.ncep.noaa.gov/, which also has a user’s guide explaining how to use their weather faxes.
Surface-analysis charts indicate the conditions that occurred at the “valid” time listed on each chart. Ships’ reports, buoy data, the shape and location of the various weather systems and the expected locations for the high- and low-pressure centers in the next 24 hours are all included. The analysis provides a picture of how the weather “looked” at a particular point in time.
Charts from the NWS marine site cover the Atlantic and Pacific oceans, the Gulf of Mexico, the tropics, Hawaii, Alaska and the Great Lakes. Forecast products include 24-, 48- and 96-hour surface prognoses as well as upper atmosphere information. By collecting this data daily before an extended passage, you can compare the forecasts with the analyses and assess their reliability. By color-coding with highlight pens the central isobars of the high- and low-pressure systems, you can see the shapes and movements of the various systems. Flicking between the chronologically-arranged surface analyses provides insight into trend lines on charts that you’ll actually be using when you’re offshore.
Collecting information from the National Data Buoy Center (NDBC) website at http://seaboard.ndbc.noaa.gov provides near real-time observations of weather conditions for all U.S. waters and has data going back for up to a day. How hard is Hurricane Dennis blowing off Charleston, and what is the sea state? What is happening right now at Buzzards Bay Tower or at Point Conception? The NDBC’s website has the answers on an hourly basis, and they can be easily accessed using their location maps. Comparing the buoy-report information to the surface analysis of the weather fax helps to put the pieces of information into perspective and provides a sense of credibility prior to going offshore.
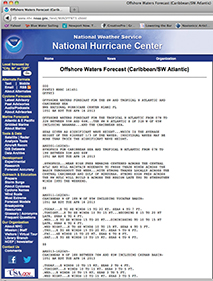
For specific information about tropical storms and hurricanes, refer to the National Hurricane Center’s site at www.nhc.noaa.gov. Not only are the storms tracked, but specific information about the latest reconnaissance flights, pressure readings and hurricane forecasts also can be accessed.
 Weather forecasts come in a variety of shapes and sizes. Most commonly available public forecasts are of minimal value to sailors looking for high quality, long range specific data. Flashing sun icons or blowing clouds provide little substantive information. However, the GRIB US computer generated forecast models located at http://www.grib.us/ provide computer generated information that goes out seven days into the future. The color-coded maps with easily understood wind barbs generate forecasts for the world’s oceans. These forecasts are computer-generated and, as such, provide some benefits as well as shortcomings. While not as detailed as forecasts created by human forecasters, such as those provided by the marine fax charts or private weather forecasting services, the computer generated models extend farther into the future and are quite easy to understand. Reliability suffers by going too far over the forecasting horizon, but that data is currently as good as it gets and gives sailors preparing for an extended passage the best information going one week into the future.
Cutting edge weather information can be accessed from a wide variety of web locations. Microwave satellite imagery, the use of lasers from space and tracking lightning strikes from space are all explained at the Global Hydrology & Climate Center site at: http://weather.msfc.nasa.gov. This site also provides near real-time satellite images of the world on an hourly basis. Infrared and visible light pictures are available, and in many cases they can be looped to provide animation, indicating the exact track of the systems. The loops can then be compared to weather fax surface analyses and earlier forecasts to further understand how the forecasts available offshore portrayed the systems. Mosaics are available to animate the entire globe’s weather, and the user can select the number of frames to loop together for varying the animation’s time length.
Oceanographic information about the Gulf Stream and other ocean currents is available at Johns Hopkins Ocean Remote Sensing’s site, http://fermi.jhuapl.edu/. Composite pictures from space are available that use the latest pictures of the areas, excluding cloud cover, to provide the most recent known information. The highly detailed color-enhanced infrared pictures can be effectively used to determine the exact location of meanders, eddies and other features of the Gulf Stream and offshore ocean areas.
For more than a decade, microwave satellite imagery has been made available to the public via the web. Using Indian and European satellites, SSM-I (Sea Surface Microwave Imagery) Derived Ocean Surface Winds’ site at http://manati.star.nesdis.noaa.gov/datasets/OSCATData.php and http://manati.star.nesdis.noaa.gov/datasets/ASCATData.php/ provide microwave satellite data that shows near real-time wind speed and direction for virtually any point on the world’s oceans. Do you need to know how much wind a low pressure system is packing on average as you get ready to take your boat to the Caribbean or Mexico for the winter? This site will give you very accurate readings—even in remote regions of the world’s oceans—as you prepare for your departure. A linked site, http://www.opc.ncep.noaa.gov/shtml/satellite_imagery.shtml (there is an underscore between satellite_imagery) overlays surface wind speed and direction on actual satellite photos, which helps a user to understand the interplay between the cloud formations and weather systems on a satellite photo and the ground wind conditions. Often the information contained on these sites is less than an hour old.
The web has a world of weather information. It can be as detailed and as cutting edge or as superficial as you require. To a large degree, whether your passage is to be the dream of a lifetime, or the trip from hell, much will depend on the weather you encounter along the way. Going sailing for an afternoon or taking a boat across an ocean requires different types of information and preparation. But in either case, the web can provide a wealth of handy information to help insure a safe and pleasant sail.
Bill Biewenga is a navigator, delivery skipper and weather router. His websites are www.weather4sailors.com and www.WxAdvantage.com. He can be contacted at billbiewenga@cox.net