


Weather forecasts can be right or wrong, but the sooner you can recognize the difference, the sooner you can take appropriate action (published July 2015)
A couple of weeks ago we were tasked to move a Hinckley 64 from the Turks and Caicos to her home port in Martha’s Vineyard. Long range forecasts implied that a low pressure system would form directly in our path, hovering over warm water, gaining energy and subsequently moving to the west—a relatively unlikely direction for weather patterns that more typically move towards the east. If the forecast held, we would be golden with following winds for most of the trip. If the forecast was wrong, we could end up in a tropical storm with strong headwinds. It seemed wise to get confirmation on the forecast and eventually move forward with a wary eye on the system.
Wind is caused by pressure gradients or “differences” in atmospheric pressure. The pressure gradients cause air to flow from an area of high pressure to one of relatively lower pressure and to be turned around a weather pattern by the Coriolis force, a deflection of the wind caused by the earth’s rotation under the air mass. In the Northern Hemisphere, wind will rotate around a high pressure system in a clockwise direction, and in the Southern Hemisphere it will rotate in a counter-clockwise direction while toeing out about 15 degrees away from the center of the high and towards an area of relatively lower pressure. Conversely, wind in the Northern Hemisphere will rotate around a low-pressure system in a counter-clockwise direction and in a clockwise direction in a Southern Hemisphere low.
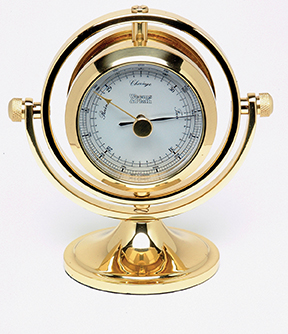
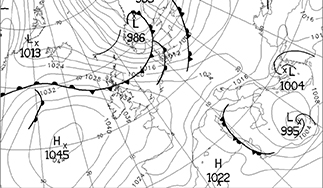
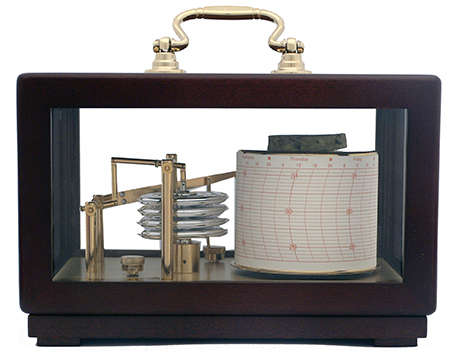
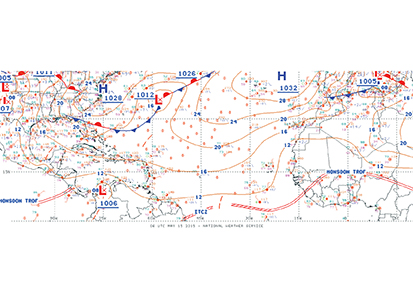
Since a barometer measures the amount of pressure, we can track the comings and goings of the various weather patterns by watching the rise and fall of the pressure readings. A little bit like a depth sounder for the atmosphere, if we know that we’re along the 1,020 mb isobar, we can see how the weather system is progressing over our position. A barograph provides a running graph of that rise and fall in pressure, while a barometer simply measures the current reading. Gradient wind speed is generally a function of how great the pressure differential is, or, stated another way, how fast the barometric pressure rises or falls over a given distance. Looking on a surface pressure weather map, the rate of change will be indicated by the relative proximity of the isobars on the map. The closer together the isobars, the greater the pressure differential over a horizontal distance and the greater the expected wind speed is.
To determine the gradient wind speed for a particular location, some weather fax maps include a “geostrophic graph” in the lower corner of the weather fax. For a given latitude and a given distance between isobars, a corresponding wind speed can be determined. If the distance between the isobars is halved, the wind speed is doubled at the same latitude on the weather map. Often, other weather fax maps include barbed wind arrows with the number of “feathers” indicating the wind strength. For a rough estimate of wind strength elsewhere on the map, compare the relative distances between the isobars along the same latitude and the wind strength will be approximately in the same ratio as the distances between the isobars.
As the wind swirls around the gradient weather patterns, the direction of the gradient wind (that wind produced by the pressure differential) will indicate the shape of the weather pattern. Simply stated, the pressure change over time will give us good clues if a system is approaching or leaving and the wind direction will provide hints about its shape and where we’re located within the system.
Local conditions however can influence the gradient weather patterns, and these influences can tend to cloud the issues. To understand whether the gradient forecast is holding, you need to understand the effect of local conditions. Local conditions may include, funneling wind down river valleys, local clouds or storm cells that may alter the pressure or wind direction by setting up their own circulation, the presence of a sea or land breeze, the proximity of warm currents, or diurnal effects on wind or pressure. When local effects are constant or well understood atmospheric pressure and wind direction changes will clearly indicate trends in things to come.
As we proceeded north from the Turks and Caicos, we remained in touch with our onshore weather consultants, Commanders’ Weather, on alternating days. We could see from the relatively stable wind direction and wind speed as well as the consistent barometric pressure readings that the system was not approaching us. We were remaining in a relatively stable set of conditions as the low pressure system moved westward towards the Carolinas and deepened as it moved away. Had the system been moving northward and away from us, we would have seen a more drastic change in the wind direction and a rise in the barometric pressure. If it had been moving closer to us, we would have seen a drop in the barometric pressure and rise in the wind speeds. Since the weather system was a Northern Hemisphere low pressure system, if it had been passing to the south of our position and moving from west to east, the wind sequence would have been generally from southerly to southeasterly to easterly to northeasterly as the barometric pressure drops and bottoms out with the winds generally out of the east. As a high passes to the south of a vessel’s position moving from west to east, the wind will back from northerly to northwesterly to westerly to southwesterly.
Here is a quick reference guide to watching how your wind direction and barometer indicate where an approaching Northern Hemisphere weather pattern is located relative to your position. If the barometer is rising (or falling) as the wind is shifting to the left, the high-pressure system (or low-pressure system) is probably located to your south. If the barometer is rising (or falling), as the wind direction is slowly shifting to the right, the high pressure system (or low pressure system) is located to your north.
Once the large scale weather systems are understood, frontal passages can also be better understood and their forecasts can be verified, as well. Often the winds preceding the fronts are southwesterly in waters around the U.S. as the troughs emanate from the lows and stretch from northeast to southeast. The wind in the front may be westerly and the post-frontal winds can be expected to go to the northwest. The gradient wind field will be the result of the pressure differential. As a general rule of thumb, the greater the temperature differential between the warm and cold air masses, the greater the pressure differential will be and the higher the wind speeds will be as you transition through the cold front. As the pressure falls and rises, the wind field can be expected to shift unless the center of the high or low pressure system is headed straight towards your position. The weather fax maps will give you an idea about the shape of the weather systems and forecast to expect, and your observations should be able to confirm or refute those forecasts.
Happily enough, the forecast held, and the early season tropical low pressure system moved away from us, inland into the Mid-Atlantic states and eventually northward, paralleling our course. For 8 days we had 15 knot southerlies, speeding us on our way to Martha’s Vineyard, and we managed to arrive safe and suntanned a couple of days ago. Had the forecast failed, the above article may have been a bit different, but the mechanics of how weather works would have been the same.
Bill Biewenga is a navigator, delivery skipper and weather router. His websites are www.weather4sailors.com and www.WxAdvantage.com. He can be contacted at billbiewenga@cox.net