


The good, the bad and the ugly truth of it all (published May 2013)
As night settles on the deck of the boat, a glow emanates from the nav station. It used to be red to protect the night vision of the deck watch. For years, it has increasingly become an irritating bright blue light streaming from a computer screen. The light first appeared on racing boats, but that, too, has changed. Computers have become ubiquitous on virtually any boat that has owners, captains or navigators who seek more information and more from that information. No longer are we satisfied with mere positioning information from the nav station. Weather, communication, performance and even routing suggestions are also available to us, leaping off the screen, day and night. But like all tools, software programs have their limitations as well as their benefits. Getting the best out of the programs requires that you also understand both the up-and down-sides.
Computers have always been good at gathering, collating and calculating data. Feed in the information and let the computer spit out the answer. But how does that help answer the ultimate navigation question, “How do we get from here to there?” Whether we’re racing or cruising, the question remains much the same. Routing software endeavors to help us find that answer, but it doesn’t give us the answer. To better understand the tools, we need to understand three key elements: the vessel’s performance characteristics, the weather and oceanographic input, and the routing software and its assumptions.
PERFORMANCE DATA
Basically, routing software takes a boat’s known performance in a variety of conditions and combines that with a digital weather forecast presented in a particular machine-readable format and gives the navigator the route that will minimize the time to travel from one point to another. Arranged in tabular form, the performance analysis measures true wind speed versus true wind angle and lists the resultant boat speed that can be expected.
If the graph of the information were plotted for each wind speed, the resulting curve would look a bit like a butterfly’s wing. The distance from the center of the graph, or polar curve, to the actual line would represent the optimal boat speed one could expect in those given conditions. The more accurate the polar information, the more accurately the routing software will be in choosing an optimal route.
Most routing programs have sub-programs to assist in developing accurate polars. These programs do not automatically update polars; instead, they help in collecting data, displaying it in an understandable way and giving the navigator the option of manually modifying the vessel’s polar tables. The initial data can be created by mathematicians, provided by the boat’s builder, or by US Sailing in some cases. The polars can provide a theoretical performance expectation based on vessel length, displacement and sail area, but that information should be further refined by actually sailing the boat and recording the data. Theoretical values almost always contain an element of error. Loaded weights, sea states, sail conditions and other factors vary and so, too, do the expected results.
Prior to collecting raw data for polar refinement, it’s extremely important to have accurately calibrated instruments. The raw data that is collected includes position, heading, boat speed, apparent wind angle, apparent wind speed and so forth. This data provides the basis for calculating other data such as true wind angle, true wind speed, true wind direction, COG (course over ground), SOG (speed over ground), set, drift and percentage of performance. Without an accurate upwash calibration, for example, there can be as much as a 15 percent error in the calculated true wind speed when a boat bears off from a beat to a run. There can also be errors of several degrees between tacks, leading to errors in the polar’s true wind angle.
WEATHER DATA
When you’ve determined your vessel’s capabilities, the next variable to consider is the expected weather and oceanographic features to be encountered. Virtually all weather routing programs accept weather forecasts and current information in GRIB format. The term “GRIB” merely means “GRaphics In Binary”. Since the data is in binary form, computers can easily use it for calculations.
With few exceptions, most GRIB files are based on computer generated models. NOAA has a website that offers GRIB forecasts, but since the information is for the entire world, it proves to be somewhat unwieldy for most private users. GRIB “choppers” have been developed for weather forecasting services, and GRIB files in a useable size are available from Ocens (http://www.ocens.com/), online at GRIB US (http://www.grib.us/) and other services.
However, computer generated models and GRIB data are not the answers to all prayers. In order to best use a tool, it is also equally important to understand the limitations. Most routing programs can animate the forecasts. A series of forecasts are put into the program, perhaps the 12 hour, 24 hour, and 48 hour surface prognostics. These are “snapshots” of what the meteorologists or computer models think the conditions will be at the various “valid times.”
To animate the forecasts smoothly, the weather display software interpolates the data and allows for various time steps between the specific forecasts—30 minutes, 45 minutes, 60 minutes or whatever the user requests. The animations link to the forecasts smoothly and give the user an idea of what direction things are moving, but in smoothing the animation, erroneous conclusions can be derived. Weather doesn’t move in such a smooth, interpolated fashion.
As an example, if a weather GRIB file implies that at 1200 Z the wind is going to be 240 degrees at 15 knots at your location and after a front goes through by 1200 Z the following day, it will be 300 degrees at 15 knots, a smooth interpolated animation will tell you that at 00 Z, between the forecasts, the wind will be 270 degrees at 15 kts. In reality, the cold front with the associated wind shift may have gone through much earlier or later, and the wind could have gusted to 35 knots during that frontal passage. The software may not have seen this transition at all.
During the 1999 hurricane season, I tracked the forecast positions of a number of hurricanes as they approached the U.S. East Coast. The GRIB files indicated the wind speeds in these hurricanes at about 40 knots, which was in some cases more than 100 knots too low. This isn’t meant to say that GRIB files and computer generated weather models are wrong, as such, but they do have limitations. They don’t pick up and accurately portray relatively localized events such as actual fronts and tropical storm systems. They work well for the larger scale gradient wind patterns and over longer-term forecasts that humans may have difficulty in predicting without the aid of computer models. Generally, they’re quite good, but they do not provide an absolutely infallible answer. Where GRIB files excel are around high pressure systems and near tropical areas.
Even with some anomalies, we gain an added understanding of what we may be able to accomplish when we integrate the GRIB weather forecasts and current data with the vessel’s polars. Our polars provide us with a digital view of what we can accomplish in a given weather situation; GRIB files provide us with a digital view of the weather forecast; and, routing software provides us with a means by which we can rapidly sort through various possible routes and select the quickest. But these solutions can also have their own set of problems that the user should understand in order to have an insight into what is actually being implied.
ROUTING SOFTWARE
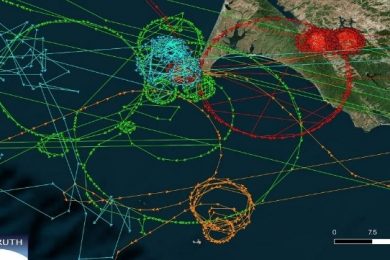
In calculating the optimal routes, most routing programs create a set of lines or “isochrones” that ripple out from the point of origin. The isochrones represent a series of points that a vessel can attain in the same time step. In other words, if a boat heads off at any heading between 110 and 200 degrees in an attempt to get to Bermuda from Newport, R.I., given the boat’s performance and the expected weather forecast, it will be somewhere along that line after one hour. It will be somewhere along the next, nearly concentric line after two hours, and along the next line after three hours, and so on. The point along the lines that gets the boat closest to Bermuda in the least time will represent the best average VMC (velocity made good on a course). In other words, the routing software is always searching for ways to minimize the distance between the vessel and its destination.
However, what happens if the route is too long for the weather forecast, such as a boat sailing from Florida to Gibraltar while avoiding the North Atlantic High and getting a GRIB weather forecast that covers only four or five days? We know that the weather forecast will run out long before the boat gets halfway across the Atlantic.
If the only waypoints put in the route are the starting point and the destination, in most cases, the software will provide a reasonable route for the first couple of days. Then, in a mistaken attempt to minimize the distance to the finish before the weather forecast runs out, the route offered by the software will head the boat into the high to generate more apparent wind and therefore more boat speed. Of course, there is no wind in the high so the choice was the wrong one.
The solution to the problem would be to input a longer range forecast that sufficiently gets the boat past the high pressure system or to “fool” the software into creating a more reliable route by indicating waypoints to the north or south of the high.
It is assumed that racing sailors are always sailing their boats to their optimal polars. That may or may not be the case. Cruisers on the other hand, have a unique set of conditions that they can input into their polars to help in accurately optimizing a route. While cruising, when the wind drops below a particular point, cruisers or people doing boat deliveries often turn on the engine.
Most of the more advanced weather routing softwares will allow for different sets of polar data. If, for example, when the wind drops below 4 knots, you intend to motor directly to your destination at 8 knots, then that can be indicated on the polar file. If low wind speed motoring isn’t accounted for in the polars, the optimal route will be wrong. West Coast navigators have known for a long time that the fastest way to return a boat from Hawaii was to motor northeasterly into the Eastern North Pacific High, cross the high north of San Francisco and reach down to Southern California. Routing software can imply the same thing, if its polars are set up correctly to reflect the actual way that the boat will be handled.
Whether you use one or more routing software packages, they are certainly worth a look. But it’s important to realize that they are tools to be used with an understanding of their own unique requirements, implications and limitations. These programs can help to confirm your original thinking or call that thinking into question; they can help you find an answer, but like all navigational tools, they, too, should be questioned. Routing software does not provide you with the answer; as the navigator, you still must determine that yourself.
NAVIGATION & WEATHER ROUTING SOFTWARE
MaxSea with the routing module www.maxsea.com
Nobeltec with Sailing Plus Windvantage routing module www.nobeltec.com
PredictWind with online routing function www.predictwind.com
Raymarine’s Raytech with advanced routing www.raymarine.com
Ocens Weathernet, Grib Explorer and MetMapper www.ocens.com