


Ocean currents are not what they used to be (published March 2013)
OK…This is not an article about climate change. Ocean currents are indeed what they used to be; it is just that we know now that they are not what we thought they were.
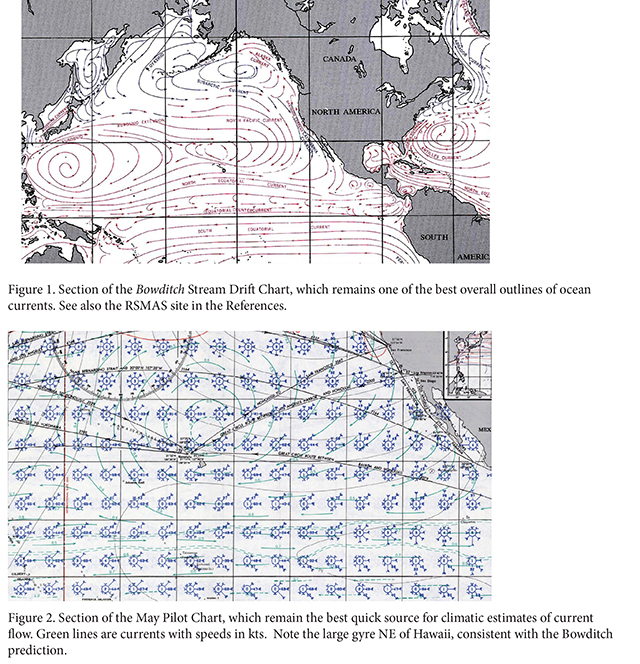
Bowditch teaches us in some detail about the various ocean circulation patterns around the world (Figure 1). They have names, average speeds, directions and water temperature. We have been taught to take these currents into account when planning ocean and coastal voyages––and they are the right answers to exam questions that come up in licensing and certification. We can learn the seasonal average values for specific locations from Pilot Charts (Figure 2). Boundaries of the Gulf Stream are shown on the OPC map of 24-hr wind and waves.
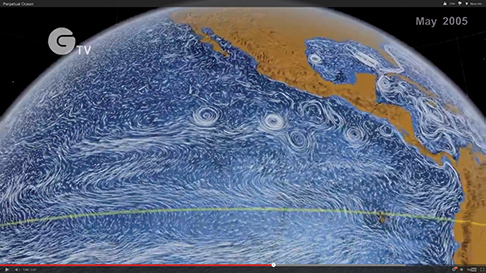
While these ocean current data remain valid and helpful in many circumstances, we know that they are a coarse outline of what the ocean surface flow really looks like at any one moment. We have learned much more about the ocean in the past five years from international satellite measurements and from the development of numerical models of the ocean. Figure 3 shows a more realistic snapshot of the ocean surface. It is far more dynamic than we might have guessed from descriptions in early navigation and weather books. We have set up links to articles, videos and other modern resources at www.starpath.com/currents. The latest Bowditch (2002) briefly mentions mesoscale eddies, but it predates new ocean research.
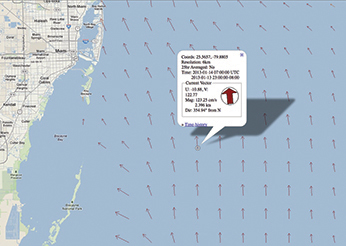
We are especially fortunate in most U.S. coastal waters to have ready access to excellent real time coastal currents from RF radar measurements (Figure 4). These are in a sense the best current data available. They also serve as a test for ocean model predictions. The Bureau of Meteorology (BOM) in Australia also has coastal current predictions online, but they are small pictures that require a subscription for a more convenient format. Nevertheless, they do show that the common descriptions we used to use for these coastal currents are over simplified.
Unfortunately, once we leave the U.S. coastal waters and travel outside the range of these RF Radar stations, we have more of a challenge in learning what others know about the currents we are sailing in. The model predictions are good, but the public distribution of this data to mariners is lagging far behind.
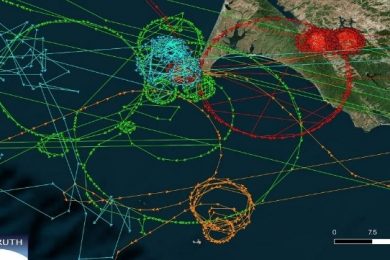
There are several private companies that provide Gulf Stream predictions, and we can also track down much of that data online, but away from the Gulf Stream and the Gulf of Mexico, it is more difficult. The Gulf of Mexico is very well studied because the great Loop Current from the Gulf Stream makes the entire U.S. East Coast vulnerable to oil spills in the Gulf. We had a close call with the Deepwater Horizon spill, but luckily the loop had pinched off into an eddy at the time
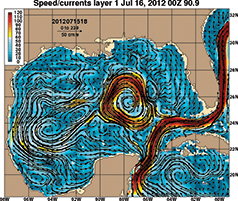
(Figure 5). Ocean currents would have been in the news a lot more than they are now had that not been the case.
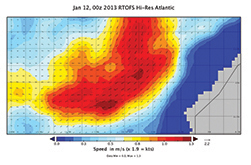
Recently, the Ocean Prediction Center (OPC) has added links to the Real Time Ocean Forecast System (RTOFS) model data, but these are more schematic pictures than real numerical data we can navigate with. We can at least see that things are very dynamic. The model is based on the Hybrid Coordinate Ocean Model HYCOM (www.hycom.org). Better detail can be seen in the U.S. Navy presentation listed in the References.
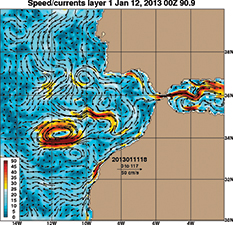
Figure 6 compares the Navy HYCOM data with the type of zooming one can do with special tools. The original data that contain the detail are in a special format that requires dedicated readers, all of which come with a learning curve. It is not user friendly. We are trying to develop a systematic way for mariners without special computer skills (like ourselves) to get access to the data. Our prescription to date is outlined at www.starpath.com/currents, along with notes on our immediate application, which is assisting the OAR NW ocean rowboat expedition to get from Dakar, Senegal to Miami, Florida by the most expeditious route. Clearly a low powered craft, row or sail, will be influenced by eddies some 300 miles long and 100 miles wide that can reach speeds of 5 knots in the middle of the ocean. A good place to learn about anomalous mesoscale current eddies is at the Archiving, Validation and Interpretation of Satellite Oceanographic (AVISO) website. It has a wealth of information and training programs.
In the meantime, mariners can find very useful data at the Navy HYCOM site for several locations. The HYCOM data and the RTOFS data are, however, available globally, not just the few places they list, nor just in the limited resolution they present in these web pages. The models have one-twelfth of a degree resolution, which is one data point every five nautical miles. We just need to convince some third-party providers to make it more readily available to cruising and racing sailors. Ideally someone will make a service like the free service we offer for satellite wind data: send us an email with your latitude and longitude and we will send back the latest ASCAT satellite wind fields. See www.starpath.com/ascat.
References
Modern Marine Weather by David Burch (Starpath Publications)
RSMAS Univ. of Miami http://oceancurrents.rsmas.miami.edu
Ocean Prediction Center www.opc.ncep.noaa.gov
Pilot Charts, Bowditch, and related links www.starpath.com/navpubs
HF Radar Currents http://cordc.ucsd.edu/projects/mapping/maps/
RTOFS http://polar.ncep.noaa.gov/ofs/viewer.shtml?-natl-cur-0-large-rundate=latest
U.S. Navy HYCOM http://www7320.nrlssc.navy.mil/GLBhycom1-12/skill.html
AVISO http://www.aviso.oceanobs.com/en/applications/ocean/mesoscale-circulation.html
Starpath currents www.starpath.com/currents